
November 28, 2018 10:06 by
 Peter
Peter
Debugging is one of the most important aspect of programming. It is crucial to successful software development, but even many experienced programmers find it challenging. With the help of keyboard shortcuts , it can be made faster. So here is the list of all shortcut keys available in visual studio for debugging.
Debugging Shortcuts in Visual Studio
|
Shortcut
|
Description
|
| Ctrl-Alt-V, A |
Displays the Auto window to view the values of variables currently in the scope of the current line of execution within the current procedure |
| Ctrl-Alt-Break |
Temporarily stops execution of all processes in a debugging session. Available only in run mode |
| Ctrl-Alt-B |
Displays the Breakpoints dialog, where you can add and modify breakpoints |
| Ctrl-Alt-C |
Displays the Call Stack window to display a list of all active procedures or stack frames for the current thread of execution. Available only in break mode |
| Ctrl-Shift-F9 |
Clears all of the breakpoints in the project |
| Ctrl-Alt-D |
Displays the Disassembly window |
| Ctrl-F9 |
Enables or disables the breakpoint on the current line of code. The line must already havek a breakpoint for this to work |
| Ctrl-Alt-E |
Displays the Exceptions dialog |
| Ctrl-Alt-I |
Displays the Immediate window, where you can evaluate expressions and execute individual commands |
| Ctrl-Alt-V, L |
Displays the Locals window to view the variables and their values for the currently selected procedure in the stack frame |
| Ctrl-Alt-M, 1 |
Displays the Memory 1 window to view memory in the process being debugged. This is particularly useful when you do not have debugging symbols available for the code you are looking at. It is also helpful for looking at large buffers, strings, and other data that does not display clearly in the Watch or Variables window |
| Ctrl-Alt-M, 2 |
Displays the Memory 2 window |
| Ctrl-Alt-M, 3 |
Displays the Memory 3 window |
| Ctrl-Alt-M, 4 |
Displays the Memory 4 window |
| Ctrl-Alt-U |
Displays the Modules window, which allows you to view the .dll or .exe files loaded by the program. In multiprocess debugging, you can right-click and select Show Modules for all programs |
| Ctrl-B |
Opens the New Breakpoint dialog |
| Ctrl-Alt-Q |
Displays the Quick Watch dialog with the current value of the selected expression. Available only in break mode. Use this command to check the current value of a variable, property, or other expression for which you have not defined a watch expression |
| Ctrl-Alt-G |
Displays the Registers window, which displays CPU register contents |
| Ctrl-Shift-F5 |
Terminates the current debugging session, rebuilds if necessary, and then starts a new debugging session. Available in break and run modes |
| Ctrl-Alt-N |
Displays the Running Documents window that displays the set of HTML documents that you are in the process of debugging. Available in break and run modes |
| Ctrl-F10 |
Starts or resumes execution of your code and then halts execution when it reaches the selected statement. This starts the debugger if it is not already running |
| Ctrl-Shift-F10 |
Sets the execution point to the line of code you choose |
| Alt-NUM * |
Highlights the next statement to be executed |
| F5 |
If not currently debugging, this runs the startup project or projects and attaches the debugger. If in break mode, this allows execution to continue (i.e., it returns to run mode). |
| Ctrl-F5 |
Runs the code without invoking the debugger. For console applications, this also arranges for the console window to stay open with a “Press any key to continue” prompt when the program finishes |
| F11 |
Executes code one statement at a time, tracing execution into function calls |
| Shift-F11 |
Executes the remaining lines of a function in which the current execution point lies |
| F10 |
Executes the next line of code but does not step into any function calls |
| Shift-F5 |
Available in break and run modes, this terminates the debugging session |
| Ctrl-Alt-V, T |
Displays the This window, which allows you to view the data members of the object associated with the current method |
| Ctrl-Alt-H |
Displays the Threads window to view all of the threads for the current process |
| F9 |
Sets or removes a breakpoint at the current line |
| Ctrl-F11 |
Displays the disassembly information for the current source file. Available only in break mode |
| Ctrl-Alt-W, 1 |
Displays the Watch 1 window to view the values of variables or watch expressions |
| Ctrl-Alt-W, 2 |
Displays the Watch 2 window |
| Ctrl-Alt-W, 3 |
Displays the Watch 3 window |
| Ctrl-Alt-W, 4 |
Displays the Watch 4 window |
| Ctrl-Alt-P |
Displays the Processes dialog, which allows you to attach or detach the debugger to one or more running processes |
November 14, 2018 08:41 by
PeterVisual Studio 2017 v15.3 or higher versions support Live Unit Testing. This feature executes the already-written test cases automatically as a programmer makes the code changes. Live Unit Testing helps a developer to do the following:
- It executes all the impacted Test Cases as a programmer modifies the code and makes sure changes do not break Unit Test Cases.
- Through the Visual Studio editor, the programmer sees the code coverage in a realistic view.
- It also indicates which line is covered or not using Live Unit Testing.
- Live Unit Testing is supported in both .NET Framework and .NET Core.
Enabling
Live Unit Testing is only available in Visual Studio 2017 with the Enterprise edition. We can enable the Live Unit Testing by going to the following menus - Test > Live Unit Testing > Start.
After enabling the Live Unit Testing for a project, Live Unit Testing shows options as Start, Pause, Stop and Reset.
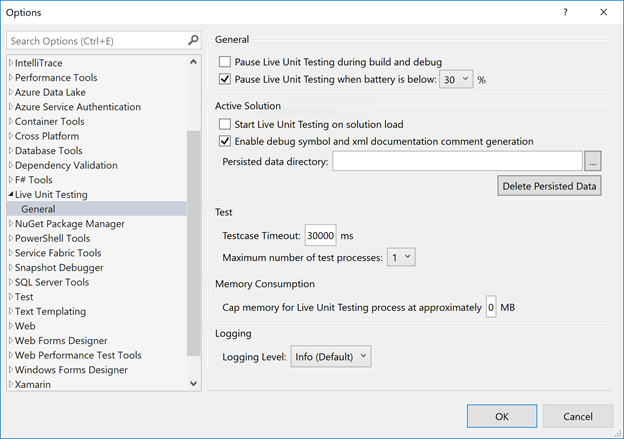
Configuration
The default configuration can be changed from the Visual Studio Menu Tool > Options > Live Unit Testing > General. We can configure the Live Unit Testing for the Battery and Memory usages, Testcase Timeout, and Logging Level can be set as needed.
Setup Project Solution
- Open the Visual Studio 2017.
- Create one Windows Library Project as “ClassLibrary1” and Change the “Class1.cs” to the “AreaCalculator.cs”.
- Right click on the solution and add a Unit Test Project as “UnitTestProject1” and change the “UnitTest1.cs” to the “AreaCalculatorTest.cs”
- Add the Reference of the “ClassLibrary1” project to the “UnitTestProject1”.
- Add the using statement “using ClassLibrary1;” to the “AreaCalculatorTest.cs” in the using statement section.
- Build the Solution.
Demo
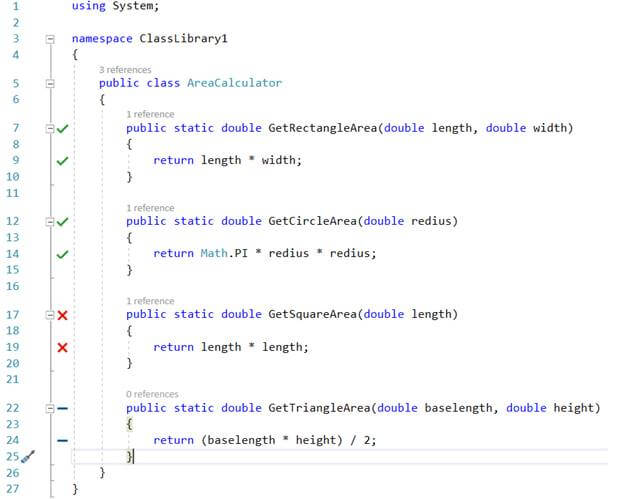
Open the AreaCalculator.cs and add the code as per the below screenshot.
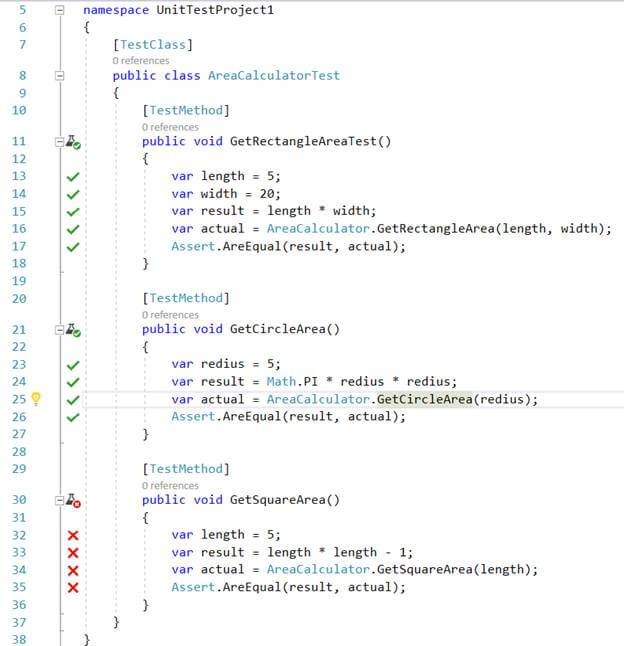
Open the AreaCalculatorTest.cs and paste the below code. I have not added the Test Method for the triangle’s area calculation and incorrectly calculated the Test Method of the square’s area, just to show some behavior of Live Unit Testing.
Replace the below code in the AreaCalculatorTest.cs file
Now start the Live Unit Testing from the Test menu, then an automatic background process triggers and we see an icon in-line with code. Description of each icon is mentioned here
- Green Tick Mark represents that this Method is covered for the unit testing.
- Cross Mark represents that this method is covered for the unit testing, but the test case failed during execution.
- Blue Negative Mark represent that this method is not covered for the unit testing so a test case needs to be created.
Below screenshots represent each icon of the Live Unit Testing
Icon’s in AreaCalculator.cs
Icon’s in AreaCalculatorTest.cs
So, with the help of Live Unit Testing of Visual Studio, a developer will know about the impact of the changes he is making, and if it's covered for unit testing or not. This is an awesome feature of Visual Studio 2017